Hartford County, Connecticut
| Hartford County, Connecticut | |
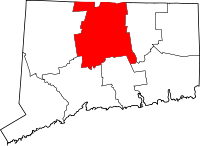
 Location in the state of Connecticut |
|
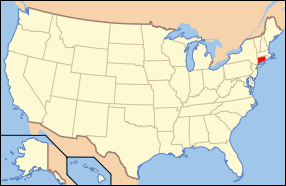
 Connecticut's location in the U.S. |
|
| Founded | 1666 (an Original County) |
|---|---|
| Seat | none; since 1960 Connecticut counties no longer have a county government |
| Largest city | Hartford |
| Area - Total - Land - Water |
751 sq mi (1,945 km²) 735 sq mi (1,904 km²) 15 sq mi (39 km²), 2.02% |
| Population - (2000) - Density |
857,183 1,165/sq mi (450/km²) |
| Congressional districts | 1st, 2nd, 5th |
Hartford County is located in the north central part of the U.S. state of Connecticut. As of 2000 the population was 857,183. The population estimate for 2005 was 877,393.
In Connecticut there is no county-level executive or legislative government; the counties determine probate, civil and criminal court boundaries, but little else. Each city or town is responsible for local services such as schools, snow removal, sewers, fire department and police departments. In Connecticut, cities and towns may agree to jointly provide services or even establish a regional school system.
Contents |
History
Hartford County was one of four original counties in Connecticut that were established on May 10, 1666, by an act of the Connecticut General Court. The act establishing the county states:
- This Court orders that the Townes on the River from ye
- north bounds of Windsor wth Farmington to ye south end of
- ye bounds of Thirty Miles Island shalbe & remaine to be one
- County wch shalbe called the County of Hartford. And it
- is ordered that the County Court shalbe kept at Hartford on
- the 1st Thursday in March and on the first Thursday in September yearely.[1]
As established in 1666, Hartford County consisted of the towns of Windsor, Wethersfield, Hartford, Farmington, and Middletown. The "Thirty Miles Island" referred to in the constituting Act was incorporated as the town of Haddam in 1668. In 1670, the town of Simsbury was established, extending Hartford County to the Massachusetts border. In the late 17th to early 18th centuries, several more towns were established and added to Hartford County: Waterbury in 1686 (transferred to New Haven County in 1728), Windham in 1694 (transferred to Windham County in 1726), Hebron in 1708 (transferred to Tolland County in 1785), Coventry in 1712 (transferred to Windham County in 1726), and Litchfield in 1722 (transferred to Litchfield County in 1751).
In 1714, all of the unincorporated territory north of the towns of Coventry and Windham in northeastern Connecticut to the Massachusetts border were placed under the jurisdiction of Hartford County. Windham County was constituted in 1726 resulting in Hartford County losing the towns of Windham, Coventry, Mansfield (incorporated in 1702), and Ashford (incorporated in 1714). Northwestern Connecticut, which was originally placed under the jurisdiction of New Haven County in 1722, was transferred to Hartford County by 1738. All of northwestern Connecticut was later constituted as a new county, Litchfield County, in 1751. In 1785, two more counties were established in the now U.S. state of Connecticut: Tolland and Middlesex. This mostly resulted in the modern extent of Hartford County. In the late 18th and early 19th centuries, the establishment of several more towns resulted in minor adjustments in the bounds of the county. The final adjustment resulting in the modern limits occurred on May 8, 1806, when the town of Canton was established.[2]
Geography
According to the U.S. Census Bureau, the county has a total area of 751 square miles (1,944 km²), of which, 735 square miles (1,905 km²) of it is land and 15 square miles (39 km²) of it (2.02%) is water.
Adjacent counties
- Hampden County, Massachusetts (north)
- Tolland County (east)
(formed 1785 from Windham) - New London County (southeast)
(formed 1666 - an Original County) - Middlesex County (south)
(formed 1785 from Hartford, New Haven & New London) - New Haven County (southwest)
(formed 1666 - an Original County) - Litchfield County (west)
(formed 1751 from Fairfield & Hartford)
 |
Hampden County, Massachusetts |  |
||
| Litchfield County | Tolland County | |||
| New Haven County | Middlesex County | New London County |
Demographics
| Historical populations | |||
|---|---|---|---|
| Census | Pop. | %± | |
| 1900 | 195,480 |
|
|
| 1910 | 250,182 | 28.0% | |
| 1920 | 336,027 | 34.3% | |
| 1930 | 421,097 | 25.3% | |
| 1940 | 450,189 | 6.9% | |
| 1950 | 539,661 | 19.9% | |
| 1960 | 689,555 | 27.8% | |
| 1970 | 816,737 | 18.4% | |
| 1980 | 807,766 | −1.1% | |
| 1990 | 851,783 | 5.4% | |
| 2000 | 857,183 | 0.6% | |
| Est. 2008 | 877,312 | 2.3% | |
As of the census[3] of 2000, there were 857,183 people, 335,098 households, and 222,505 families residing in the county. The population density was 1,166 people per square mile (450/km²). There were 353,022 housing units at an average density of 480 per square mile (185/km²). The racial makeup of the county was 76.90% White, 11.66% Black or African American, 0.23% Native American, 2.42% Asian, 0.04% Pacific Islander, 6.43% from other races, and 2.31% from two or more races. 11.55% of the population were Hispanic or Latino of any race. 15.2% were of Italian, 11.2% Irish, 9.1% Polish, 6.5% English, 5.7% French and 5.3% German ancestry according to Census 2000. 78.4% spoke English, 10.3% Spanish, 2.6% Polish, 1.9% French and 1.6% Italian as their first language.
There were 335,098 households out of which 31.30% had children under the age of 18 living with them, 49.20% were married couples living together, 13.50% had a female householder with no husband present, and 33.60% were non-families. 27.90% of all households were made up of individuals and 10.70% had someone living alone who was 65 years of age or older. The average household size was 2.48 and the average family size was 3.05.
In the county the population was spread out with 24.60% under the age of 18, 7.80% from 18 to 24, 29.80% from 25 to 44, 23.20% from 45 to 64, and 14.70% who were 65 years of age or older. The median age was 38 years. For every 100 females there were 92.70 males. For every 100 females age 18 and over, there were 89.00 males.
The median income for a household in the county was $50,756, and the median income for a family was $62,144. Males had a median income of $43,985 versus $33,042 for females. The per capita income for the county was $26,047. About 7.10% of families and 9.30% of the population were below the poverty line, including 12.90% of those under age 18 and 7.60% of those age 65 or over.
Politics
| Year | Republican | Democratic |
|---|---|---|
| 2008 | 33.7% 138,984 | 65.1% 268,721 |
| 2004 | 39.5% 154,919 | 58.7% 229,902 |
| 2000 | 34.7% 127,468 | 60.2% 221,167 |
| 1996 | 31.3% 111,566 | 57.0% 203,549 |
| 1992 | 32.0% 132,591 | 47.1% 195,495 |
| 1988 | 46.0% 173,031 | 53.1% 199,857 |
| 1984 | 55.0% 208,210 | 44.6% 168,609 |
| 1980 | 40.5% 150,265 | 44.3% 164,643 |
| 1976 | 47.5% 175,064 | 51.9% 191,257 |
| 1972 | 52.1% 194,095 | 46.9% 174,837 |
| 1968 | 38.8% 131,740 | 56.2% 190,865 |
| 1964 | 27.0% 88,811 | 72.9% 240,071 |
| 1960 | 41.1% 136,459 | 58.9% 195,403 |
Cities, towns, and villages*
- Avon (Town)
- Berlin (Town)
- -- Kensington (a section of Berlin)
- Bloomfield (Town)
- --Blue Hills (a village of Bloomfield)
- Bristol (City)
- --Forestville (a section of Bristol)
- Burlington (Town)
- Canton (Town)
- --Collinsville (a village of Canton)
- East Granby (Town)
- East Hartford (Town)
- East Windsor (Town)
- Enfield (Town)
- --Thompsonville (a village of Enfield)
- Farmington (Town)
- Glastonbury (Town)
- Granby (Town)
- --North Granby (a village of Granby)
- --West Granby (a village of Granby)
- Hartford (City)
- Hartland (Town)
- --East Hartland (a village of Hartland)
- --West Hartland (a village of Hartland)
- Manchester (Town)
- Marlborough (Town)
- --Terramuggus (a village of Marlborough)
- New Britain (City)
- Newington (Town)
- Plainville (Town)
- Rocky Hill (Town)
- Simsbury (Town)
- --Tariffville (a village of Simsbury)
- --Weatogue (a village of Simsbury)
- --West Simsbury (a village of Simsbury)
- South Windsor (Town)
- Southington (Town)
- --Plantsville (a section of Southington)
- --Marion Historic District (a section of Southington)
- --Milldale (a section of Southington)
- Suffield (Town)
- --Suffield Depot (a village of Suffield)
- West Hartford (Town)
- -- Bishop's Corner (a neighborhood of West Hartford)
- -- Elmwood (a neighborhood of West Hartford)
- Wethersfield
- Windsor Locks (Town)
- Windsor (Town)
- --Poquonock (a village of Windsor)
- --Wilson (a village of Windsor)
* Villages are named localities within towns, but have no separate corporate existence from the towns they are in.
References
- ↑ "CCR: Volume 02, Page 39". http://www.colonialct.uconn.edu/ViewPageBySequentialID.cfm?v=02&p=39&c=4&StartVolume=1&StartPage=1. Retrieved 2008-06-17.
- ↑ Newberry Library -- Connecticut Atlas of Historical County Boundaries
- ↑ "American FactFinder". United States Census Bureau. http://factfinder.census.gov. Retrieved 2008-01-31.
External links
- Hartford County Fire Emergency Plan and Fire School
- National Register of Historic Places listing for Hartford Co., Connecticut
- Central Regional Tourism District
|
|||||||||||||
|
||||||||||||||||||||